

FAQs – Use of Force
Background
To fulfill a requirement of the consent decree, and as part of its commitment to operating as a learning, self‑correcting organization that continually enhances its policies, training, and supervision, the Chicago Police Department (CPD) engaged a team of researchers to analyze use of force and related data to better understand patterns and trends. In keeping with CPD’s ongoing commitment to transparency, the Department is publishing this Q&A page to help the public better understand both the study and other topics of concern related to use of force.

Study Purpose
What is the report about?
The study conducted by the research team analyzed CPD’s use of force incidents from 2020-2023. It provides a comprehensive examination of when and how force was used along with how patterns differ across demographic groups.
Who did the study?
The study was conducted by two researchers from the University of Texas at San Antonio and one researcher from the University of Pennsylvania. All three are academic researchers with doctoral degrees and expertise in criminology, criminal justice, and public policy. They have extensive experience analyzing policing data and evaluating criminal justice practices.
Does the report evaluate whether CPD is complying with the consent decree?
The report does not directly evaluate whether CPD is complying with its consent decree. However, CPD is utilizing the study, in part, to evaluate its policies, training, and practices, all of which are tied to the consent decree.
Data and Definitions
What data did they use?
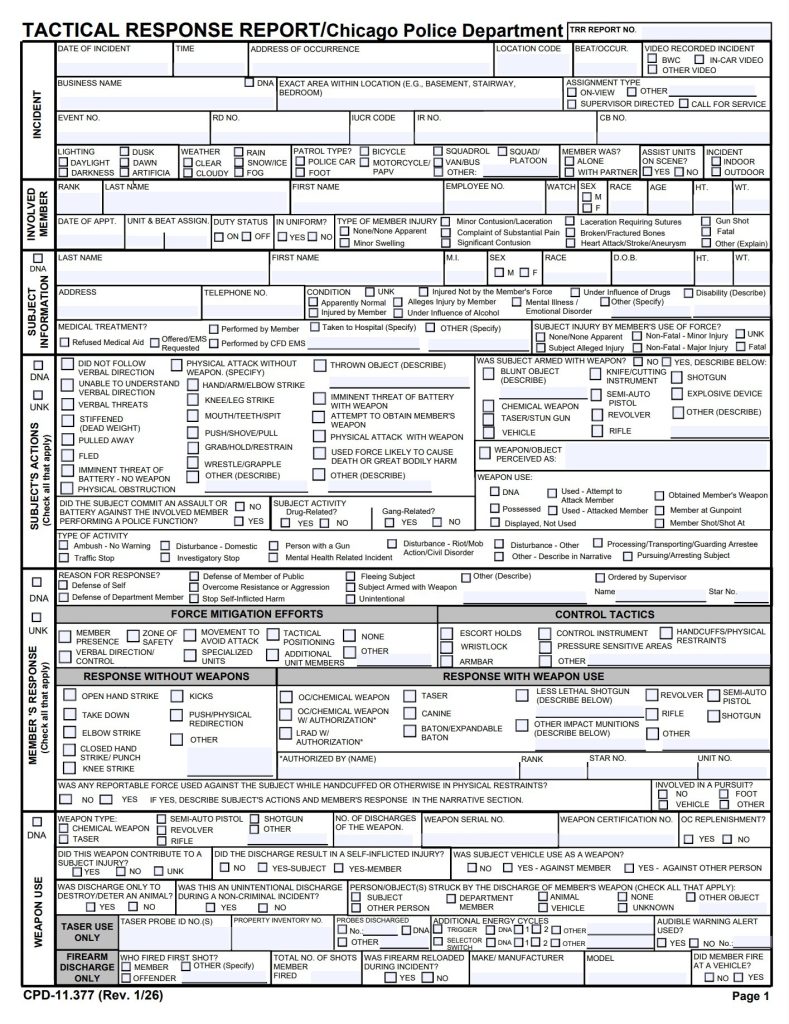
The researchers used CPD use of force data, primarily from CPD’s Tactical Response Report (TRR), which officers complete to document use of force, including against persons and animals. Officers also complete TRRs to document an assault or battery against an officer, regardless of whether an officer used force. For the purposes of this FAQs page, only data from TRRs reporting force against a person are included. If multiple officers use force to control a single person, each officer must complete a separate TRR. The analysis also incorporated information on levels of resistance and force, officer and subject characteristics, injuries, arrests, suspect data, 911 calls for service, officer assignments, mission deployments, and census data. Together, these sources were used to understand when and where force occurred and how these patterns related to broader police enforcement activities.
What is “resistance”?
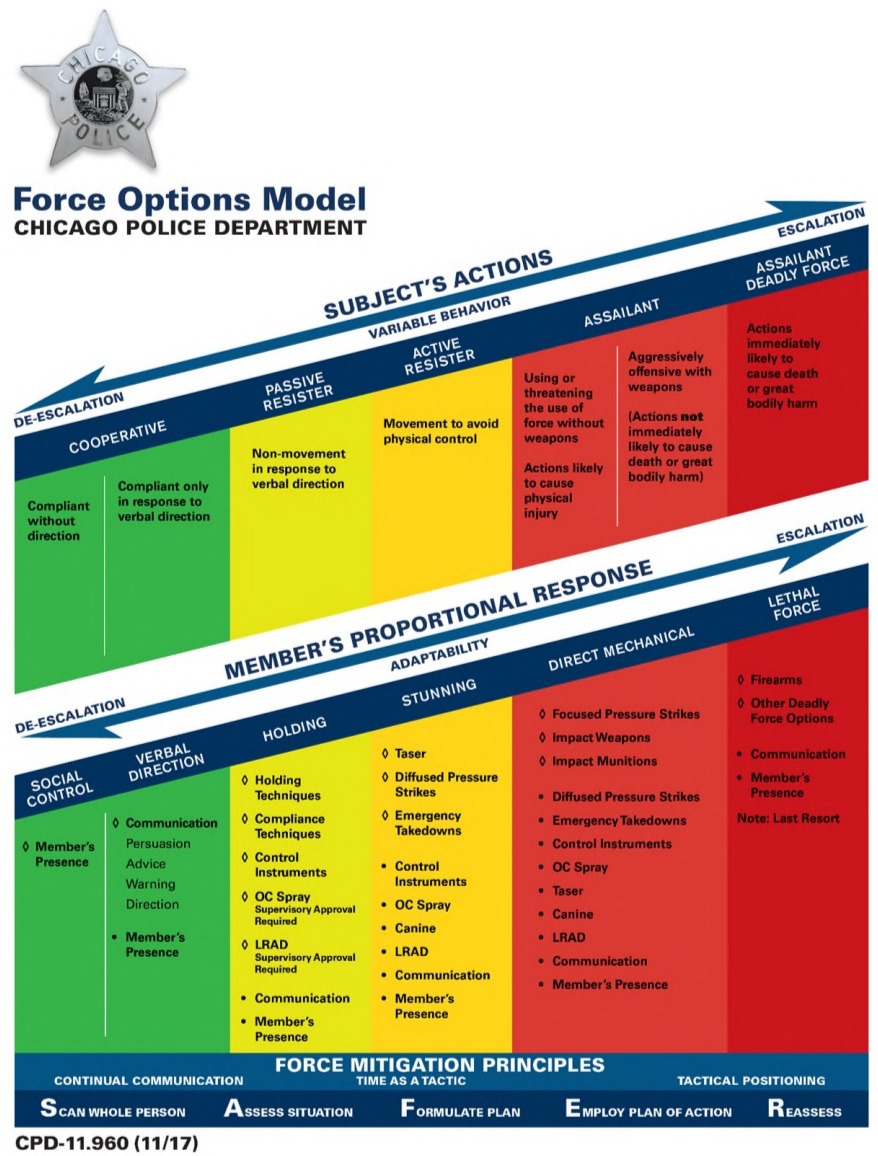
Resistance refers to actions a person takes to avoid control by an officer. CPD categorizes a person’s resistance into levels, including passive resistance (not moving in response to officer direction), active resistance (movement to avoid an officer’s control), and assailant behavior (actions or threats likely to cause physical injury).
What is CPD’s “Force Options Model”?
CPD’s Force Options Model (pictured) is a framework that outlines which types of force officers may use based on a person’s actions. It emphasizes that officers should use the minimum amount of force needed to safely and lawfully overcome resistance.
How does the study measure force?
The study measures force using levels recorded in Tactical Response Reports, which categorize different types and degrees of force. It also uses measures such as “maximum force level” (the highest level of force used by an officer during an incident), “total force” (the sum of all types of force used by an officer), and “force factor” (a measure comparing the level of force used to the level of resistance encountered).
What is force mitigation?
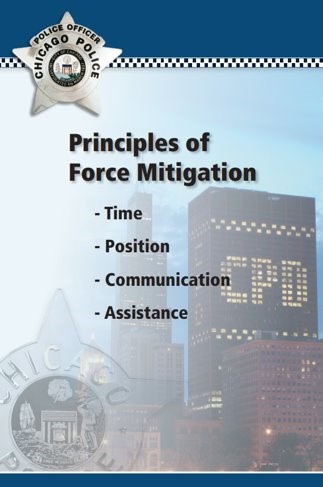
Force mitigation (also called de-escalation) refers to the steps officers take to avoid or reduce the amount of force needed to control a person. Examples include verbal direction (warning, persuasion, and advice), using time as a tactic to slow situations down, keeping a safe distance while giving verbal direction, and requesting assistance.
Use of force does not necessarily equate to a failure in de-escalation. Even when officers cannot avoid using force, de-escalation may reduce the amount of force needed to gain control, consistent with CPD policy. Research supports the effectiveness of de-escalation.
Analysis & Key Findings
How does the study evaluate use of force?
The study evaluates use of force by establishing a statistical benchmark (a baseline for seeing if something is higher or lower than expected) that measures the maximum force used, total force used, the level of force relative to a person’s resistance, and injuries. These models incorporate information about the incident, officers, individuals, crime types, and neighborhood context to identify factors that increase or decrease the likelihood of force. In short, the models show how each factor affects use of force outcomes.
How does the study use geographic comparisons?
The City is divided into 22 police districts and 274 police beats (269 excluding O’Hare Airport), each with its own demographic information. This study compares use of force data across these geographic areas to identify patterns and differences.
What are “disparity” or “disproportionality” ratios.
Disparity or disproportionality ratios compare how often force is used against one group (by race, ethnicity, or gender) relative to another. They show whether a group experiences force more or less often than expected based on benchmarks such as arrests or suspects.
Does the study compare use of force rates to Chicago’s overall demographic makeup?
No. The study focuses on how force relates to police encounters, rather than the city’s general population. Use of force data tied to police activity provides more meaningful context when evaluating CPD policies, training, and practices.
How does crime relate to force?
The study shows that force is documented more often in areas with higher levels of reported crime (especially violent crime) and in locations with greater police activity, where officers have more frequent interactions with the public, make more arrests, and encounter enforcement situations.
Did the study find differences in CPD’s uses of force by race, ethnicity, and gender?
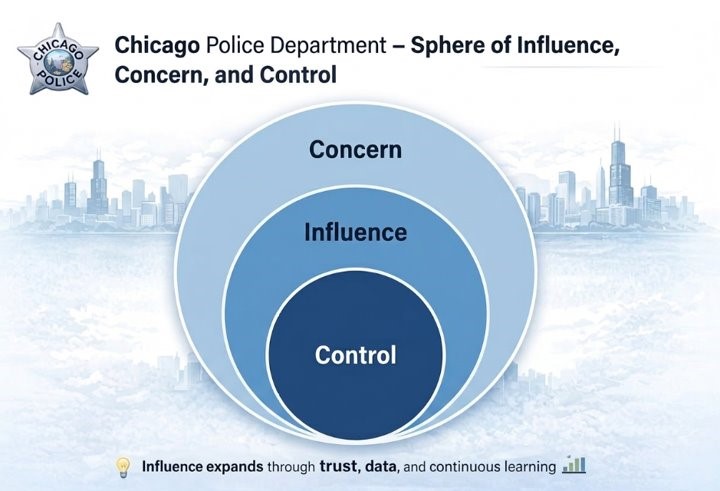
Yes, the report found differences in use of force across race, ethnicity, and gender. Black individuals experience force at higher rates than White or Hispanic individuals when compared with arrest and crime‑suspect benchmarks, and Hispanic individuals experience force at higher rates than White individuals. Men also experience force more often than women. While further tests for statistical significance showed these differences could be the result of chance, CPD acknowledges that the stable patterns across years suggest that Black and Hispanic individuals may be at moderately higher risk for force compared to Whites. However, the study did not identify the underlying causes of these patterns. Contributing factors may relate to individual officer training and experience, characteristics of individuals officers interact with, or broader environmental conditions. Some of these factors fall within CPD’s control, while others do not.
CPD remains committed to understanding and improving the factors it can control, including policy, training, and accountability systems. For example, the Tactical Review and Evaluation Division continues to monitor patterns, trends, and emerging concerns related to use of force and provides ongoing feedback to individuals, districts, and the Department. CPD is also expanding its District‑level Review Program, described further below under “How will CPD use the study findings?”
Does the study prove discriminatory policing by CPD?
No. The study found that officers use force most frequently in neighborhoods with higher levels of police activity, arrests, and identified crime suspects. As a result, force is concentrated in specific areas rather than evenly distributed across the city. After accounting for factors such as violent crime, suspect demographics, and resistance, the level of force experienced by Black individuals was not statistically different from that experienced by White individuals. Hispanic individuals experienced slightly higher levels of force relative to their level of resistance compared with White individuals. The study did not identify the reasons for these patterns, nor did it find evidence of intentional discrimination by CPD.
Many factors may contribute to these differences, including officer‑related factors, characteristics of individuals officers interact with, or broader environmental conditions. Recognizing that force is used more frequently in some communities, CPD will continue strengthening the areas where it can have the greatest impact, such as quality training on de‑escalation and implicit bias, enhanced supervision, and effective accountability measures.
How does the average level of force used by officers compare to a person’s level of resistance?
One of the noteworthy elements of this study was its comparison between the average level of force officers used and the level of resistance they encountered. They did this by assigning numerical values (1-5) to both a person’s level of resistance and an officer’s use of force. This comparison helps assess whether officers are following policies and training that specify which types of force are appropriate in different situations. The study found that, on average, CPD officers use less force than the maximum allowed for the level of resistance they face. This consistent use of lower levels of force reflects CPD’s emphasis on de escalation, and importantly, this general pattern holds across all demographic groups.
How will CPD use the study findings?
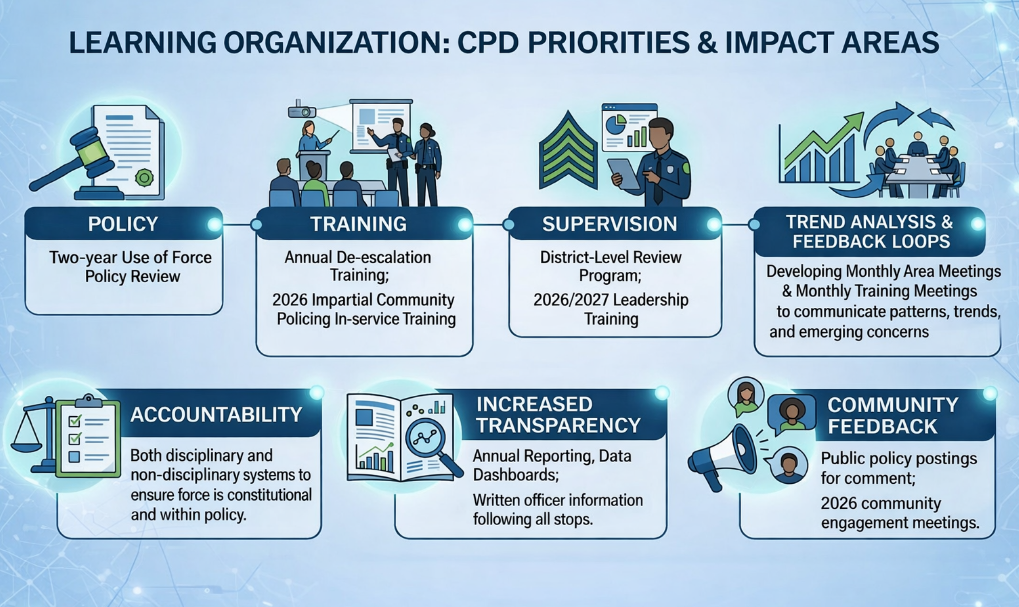
CPD is using this study as a foundation for ongoing analyses to monitor patterns, evaluate reforms, and guide policy, training, and supervision. Building on this work, CPD is expanding its District‑level Review Program to strengthen feedback loops on patterns, trends, and emerging concerns, while also enhancing accountability at the district level.
The analytical approach used in this study provides a repeatable framework that CPD can use to track trends over time and better understand the factors it can most effectively address related to officer uses of force. CPD takes these findings seriously and is committed to applying this approach as part of its broader effort to function as a learning, self‑correcting organization. Insights from these analyses will continue to inform improvements to policy, training, supervision, and accountability systems to better serve the communities of Chicago.
Additional Concerns Not Directly Addressed In The Study
Unless otherwise noted, all data is accurate as of 04/07/2026.
How often does CPD use force?
Every time one or more officers use reportable force to gain compliance, CPD classifies this as a use of force incident. If multiple officers use force during the same incident, each officer must complete a separate report. Each of these reports is considered an occurrence. For example, if two officers use firm grips and control holds on one active resister, this is counted as one incident with two occurrences.
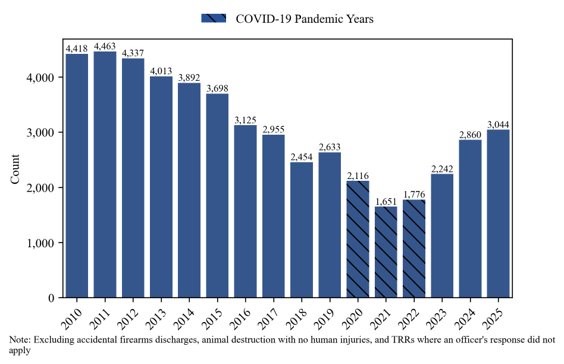
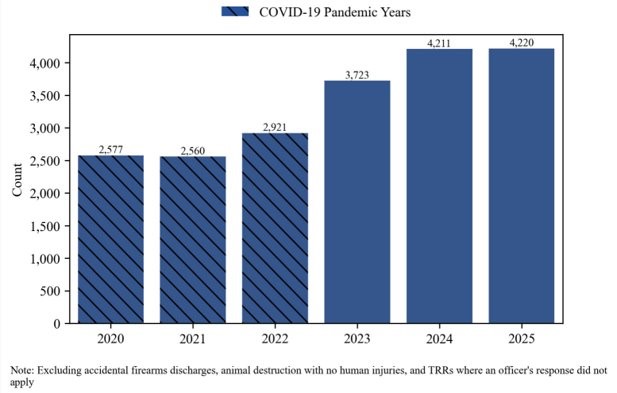
In 2025, there were just over 3,000 use of force incidents, resulting in just under 6,500 occurrences. This means that, on average, each incident involved a little more than two occurrences.
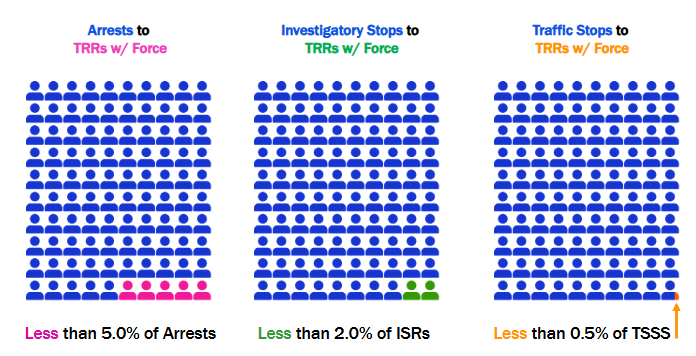
CPD uses force in only a small fraction of officer interactions. Even when an interaction results in some type of police activity, only a very small percentage involve the use of force. For example, less than 5 percent of arrests, less than 2 percent of investigatory stops, and less than 0.5 percent of traffic stops involve any use of force.
Are the number of use of force incidents going up in Chicago?
When looking only at the years following the COVID‑19 pandemic, use of force incidents have increased. However, when compared to pre‑pandemic levels, overall use of force is trending downward. As the study noted, use of force patterns closely track police activity and arrests, both of which dropped during the pandemic.
The recent increase is largely tied to a rise in lower‑level physical force, including emergency handcuffing (e.g., handcuffing a person who is actively resisting), escort holds (e.g., firm grips and holding techniques used to escort someone to a police vehicle while they resist), physical redirection (e.g., pushing someone backward who is advancing toward an officer and making threats in order to create distance), and takedowns (physically directing a person to the ground). This coincides with CPD’s emphasis in training on the reporting of lower‑level force in 2023 and 2024, including during preparation for the 2024 Democratic National Convention. During the same period, CPD’s Tactical Review and Evaluation Division also focused on reinforcing reporting requirements with supervisors, particularly for lower‑level force. Accordingly, CPD has seen an increase in the reporting of lower levels of force.
How often are shots fired by CPD officers?
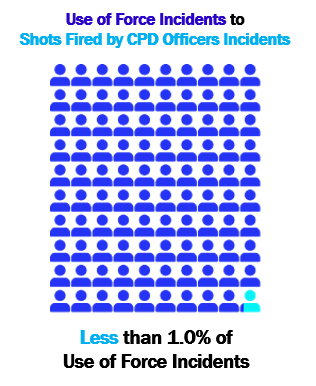
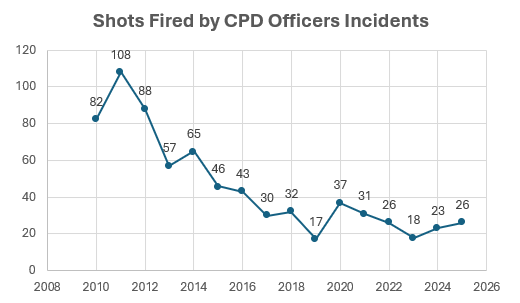
For this FAQ, “shots fired by CPD officers” refers to any incident in which at least one officer fired at least one shot toward a person. Compared with the total amount of police activity, these incidents are extremely rare. As noted above, CPD officers use force in only a small share of their interactions, and shootings represent an even smaller portion of those cases.
In 2025, there were approximately 3,044 use of force incidents, and 26 of them (less than 1%) involved shots fired by CPD officers. Although the numbers vary by year, the overall trend shows a decline in shots fired by CPD officers since 2010. Comparing 2010 with 2025, they have decreased 68%.
These incidents are taken very seriously and receive multiple layers of review. The Civilian Office of Police Accountability (COPA), an independent oversight agency, investigates every incident to determine whether the involved officers and supervisors acted within policy. Separately, the Cook County State’s Attorney’s Office reviews each case for compliance with Illinois law. CPD also conducts its own review to identify any tactical, training, or equipment issues related to the officers and supervisors involved.
Note: The Bureau of Detectives (BOD) is responsible for verifying an officer discharged their weapon. The incident totals listed here are based on BOD data.
How often do CPD officers discharge Tasers and Oleoresin Capsicum (OC) Spray?
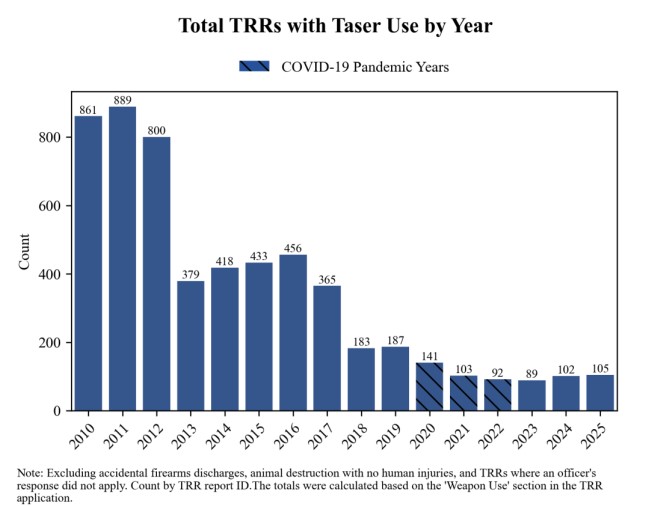
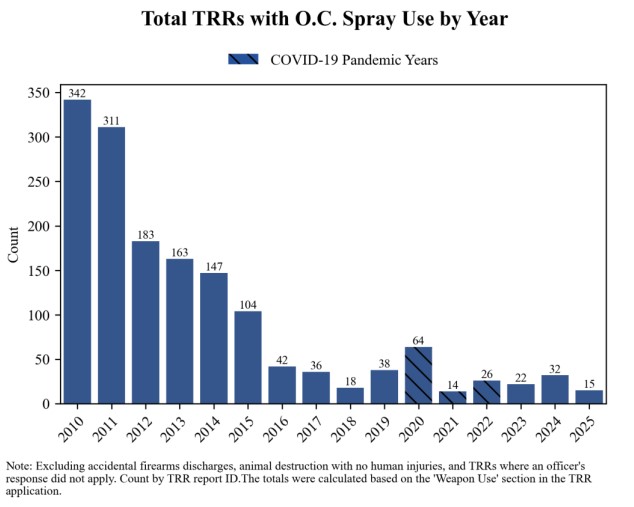
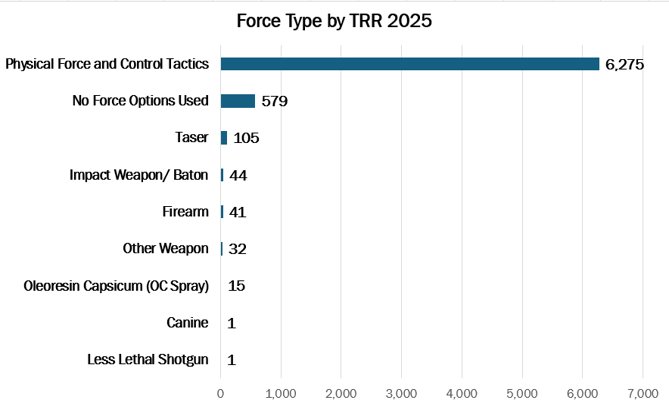
For this FAQ, a “discharge” refers to any instance in which a single officer deploys a Taser or OC Spray at least once during an incident. Taser and OC Spray discharges are relatively rare. In 2025, CPD officers discharged a Taser 105 times, representing 1.6% of all use of force occurrences. OC Spray discharges were even less common: officers discharged OC Spray 15 times in 2025, accounting for just 0.02% of use of force occurrences.
There has been a consistent decline in both Taser and OC Spray usage since 2010. Comparing 2010 with 2025, Taser usage has decreased by 88%, and OC Spray usage has decreased by 96%.
What types of force are most common?
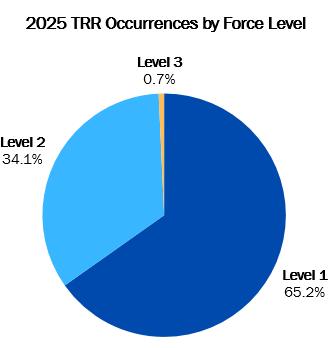
CPD categorizes reportable use of force into one of three levels:
- Level 1 – Involves actions that are likely to cause pain or injury but do not result in a reported injury or allegation of injury.
- Level 2 – Includes actions that result in a reported injury or complaint of injury, as well as the use of weapons other than a firearm (e.g., Taser, OC, baton, etc.).
- Level 3 – Involves deadly force or actions that result in a life-threatening injury, or force resulting in a hospital admission.
Approximately two-thirds of TRRs are Level 1 (weaponless and no injury or allegation of injury), which have seen the highest increase over the past few years.
Within physical force options and control tactics, the most common force options used by CPD officers include: 1. Handcuffing; 2. Escort Holds; 3. Physical Redirection; and 4. Take Downs. Note: Multiple force types may be used in a single incident.
Is CPD increasingly using force specifically against young people?
Use of force against youth has declined sharply since 2010, a trend that is especially notable given that past reporting requirements were less stringent and accountability systems have since become more robust. Although there has been an increase since 2022, levels in 2024 remain far below the peaks of the early 2010s. The recent rise appears to reflect a return from unusually low pandemic‑era levels, an increase in large youth gatherings that sometimes required enforcement to maintain public safety, and continued improvements in reporting and accountability.
Can CPD adjust its practices to ensure use of force numbers match the city’s population by race and gender?
No. CPD does not set use of force targets based on population demographics. Police actions are driven by calls for service, reported crime, and observed behavior. Aligning outcomes strictly to population demographics, without considering these factors, would be inconsistent with constitutional policing. Residential demographics also do not reflect who officers actually encounter, since people move throughout the city for work, travel, social activities, and, at times, criminal activity. Forcing use of force numbers to match population ratios would ignore real crime patterns and could pressure officers to make decisions based on race instead of behavior, which would be unconstitutional. CPD acknowledges that everyone has implicit biases, so officers receive training to recognize those biases and make decisions based on clear observations and facts. Research shows this training helps officers rely on objective information rather than bias, and CPD remains committed to this training.
Is CPD increasingly pointing firearms at persons?
While firearm‑pointing incidents have increased, this may reflect improved reporting, clearer policies, better tracking, directed training on reporting requirements, and a return to pre‑pandemic activity levels. CPD adopted its firearm‑pointing policy in 2019, with full data collection beginning in 2020, shortly before the start of the COVID-19 pandemic. The impact of the pandemic and the policy’s relative newness make it difficult to establish a stable, long‑term baseline. When reviewing practices, CPD must balance the potential trauma of pointing a firearm at someone with the reality that officers routinely respond to violence and recover more than 12,000 guns each year. In 2025, CPD launched a district‑level review program in which Captains assess firearm‑pointing incidents that occur in their districts. Districts that piloted the program saw about a 16 percent decrease in firearm‑pointing incidents in the second half of 2025, and CPD is continuing to expand this initiative.
Is it the Department’s ultimate goal to lower the number of use of force incidents?
The department’s highest priority is the sanctity of human life. While both CPD and the community want to see fewer use of force incidents, officers must respond to the actions of others and cannot control every situation. Officers are trained to de‑escalate while gaining control, but their influence is sometimes limited. Therefore, CPD focuses on what it can control, such as ensuring police interactions are constitutional and comply with policy.
What systems are in place to hold officers accountable for use of force?
CPD uses multiple layers of accountability. A department supervisor responds to the scene when a weapon is used or there is an injury or allegation of injury. The supervisor documents injuries and identifies witnesses. A lieutenant or above then reviews body‑worn camera footage for all use of force incidents, talks to the person on whom force was used, and reviews reports to determine whether the force was within policy. As an added layer of review, CPD’s Tactical Review and Evaluation Division reviews all weapon‑related incidents (including use of Tasers, OC, and batons), force involving injury or alleged injury, foot pursuits, firearm pointings, and a sample of other cases. If misconduct is identified at any point, supervisors must notify the Civilian Office of Police Accountability (COPA). Any person may also file a complaint directly with COPA or CPD.
Have excessive force complaints risen over time?
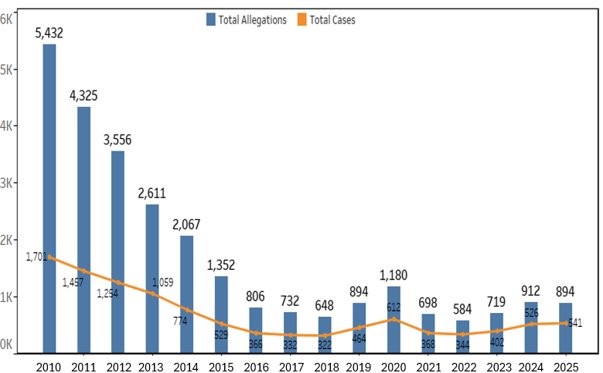
Similar to use of force totals, complaints of excessive force have seen a significant structural decline since 2010. Total Allegations in 2025 (894) represent a fraction of the 2010 peak (5,432). Even though reporting compliance has increased, the volume of misconduct claims remains far below the historical norms.
Multiple factors likely contributed to the long-term decline in excessive force complaints, including changes in policy, enhanced training, increased supervision, and the continued development of accountability systems. While the precise causes of the decline cannot be isolated, the long-term trend reflects overall improvement over time.
How do I file a complaint of excessive force?
There are a number of ways to contact COPA in order to file a complaint:
- Phone: (312) 743-COPA (24-hour complaint line)
- TTY: (312) 745-3593
- Online: https://www.chicagocopa.org/complaints/intake-form/
- Mail:
- Civilian Office of Police Accountability
- c/o COPA Intake Section
- 1615 W. Chicago Ave.,
- 4th Floor Chicago, IL 60622
Anyone may also file a complaint at any district station, and CPD will immediately forward the complaint to COPA.
Additional Resources
Where can I read the study report?
Where can I learn more about CPD use of force?
Here is a link to CPD’s Annual Use of Force Report and TRED Reports:
Public Hearing Presentations
This page provides public access to presentations shared during past Chicago Police Department Public Hearings and Committee Events. These materials reflect key initiatives, progress updates, and areas of reform within the department.
By making these presentations available, CPD aims to promote transparency, keep the public informed, and highlight the department’s ongoing efforts to build trust and improve public safety citywide.